Power Station Runtime Calculator
My power plan
Inputs
4 sectionsEquipment library
Choose a preset or add your own equipment.
Example watts — edit to match your equipment.
64 matching items · All presets use AC input initially.
Selected equipment
No equipment added.
Setup
Power station
Station output ratings (optional)
Watt ratings alone cannot establish equipment compatibility.
Use nominal stored energy. Already measured usable output energy is not supported by this model.
Assumptions
10% reserve · 85% AC efficiency · 10% extra capacity margin
Edit charge window and losses
These defaults are editable assumptions. Reserve defines the lower charge limit; no second depth-of-discharge reduction is applied.
Estimate battery runtime for a repeating equipment load
Compare available battery energy with a continuous duty-and-standby load pattern.
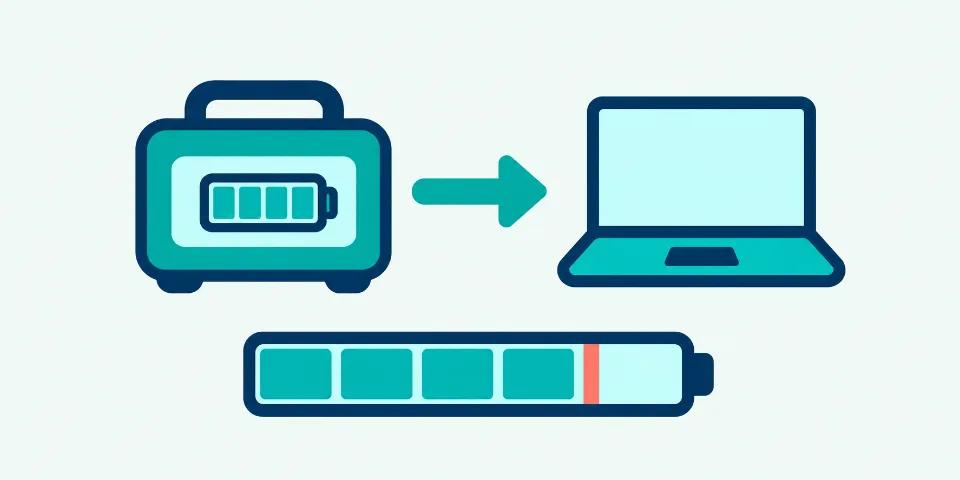
Use runtime view when the main question is how long a known battery can support equipment. It repeats the entered running, duty and off-cycle pattern until the selected reserve is reached; per-device sizing hours are intentionally excluded.
Explain what changes the runtime
Runtime moves when available battery energy or average battery-side demand changes. Use the result to identify which measured input would most improve the estimate before changing several assumptions at once.
- Runtime is shorter than required
- Reduce the repeated load, lower the reserve only when acceptable, or compare more nominal capacity after checking output compatibility.
- Runtime looks unusually long
- Check for a measured average that was also given a reduced duty cycle, missing station overhead or an optimistic starting charge.
- An output check fails
- Treat the runtime as unusable for that station until continuous or startup demand fits the corresponding rating.
Before timing a real test
- Charge to the same starting percentage used in the estimate.
- Record the reserve percentage where the test stops.
- Measure the largest uncertain load during representative operation.
- Note ambient temperature and any equipment mode changes.
Method, formulas and verification
Understand the calculation path, the strongest inputs and the limits to verify.
- Battery label
Nominal Wh and capacity retention
- Usable window
Starting charge minus reserve
- Battery demand
Load, conversion loss and overhead
- Runtime
Available Wh divided by average battery W
Enter the battery energy that is actually available
Start with nominal watt-hours, or convert amp-hours using the matching nominal battery voltage. Starting charge, reserve and capacity retention reduce the energy available to the estimate. AC and DC efficiency and station overhead reduce how much of that energy reaches the equipment.
Build a repeating load pattern
A constant device normally uses 100% duty. A cycling device uses running watts during its duty fraction and off-cycle watts for the rest. If you already measured its time-averaged input, enter that average at 100% duty to avoid reducing it twice. Separate rows preserve different models and operating modes.
Interpret runtime with operating limits
The result is the mathematical depletion time for the entered pattern. Real runtime can shift with temperature, battery protection, load-dependent efficiency, aging and changing demand. The output checks still need to cover simultaneous running power and any known startup event.
Available battery energy
Nominal Wh × retention × (start − reserve)Start and reserve are fractions of the retained nominal capacity.
Average battery demand
AC average W ÷ AC efficiency + DC average W ÷ DC efficiency + overheadThe pattern repeats continuously in this view.
Runtime
Available battery Wh ÷ average battery WA zero load has no finite depletion estimate.
What changes the result most?
Change one input at a time and keep the measurement or specification that supports it.
| Input | Effect on the answer | What to verify |
|---|---|---|
| Starting charge and reserve | Define how much retained battery energy is available. | Match the percentages used during the real test. |
| Average load | Higher repeating demand shortens runtime. | Measure changing or cycling equipment over time. |
| AC or DC path | Applies the entered conversion efficiency for that output path. | Choose the port type actually used by the equipment. |
| Station overhead | Matters most when the equipment load is small. | Avoid adding overhead already included in a measured end-to-end value. |
Common terminology
- Runtime
- running time, battery duration, backup time
- Load
- power draw, consumption, demand
- Duty cycle
- cycling percentage, on-time fraction
- Available energy
- usable battery energy, working Wh
Common mistakes
- Reducing a measured average twiceUse a measured time-average at 100% duty unless it represents only the on-state.
- Using amp-hours without voltageAmp-hours convert to watt-hours only with the matching nominal battery voltage.
- Reading runtime as a guaranteeTemperature, battery condition, protection limits and changing loads can alter a physical test.
Separate stored energy from equipment power
Battery watt-hours describe an energy supply, while equipment watts describe the rate at which it is consumed. Runtime divides available battery energy by average battery-side demand. The station still needs enough continuous and startup output to operate the load, so a long mathematical duration is not useful when the entered station rating fails an output check.
Set the battery charge span used by the test
Nominal capacity is reduced by capacity retention, then by the difference between starting charge and reserve. Reserve is the charge deliberately left unused; it is not a second conversion loss. When starting from amp-hours, use the matching nominal battery voltage to obtain watt-hours rather than an AC outlet or USB voltage.
Build a repeating average load
Runtime view repeats the entered running, duty and off-cycle pattern until the available energy is depleted. A measured time-average normally uses 100% duty and zero off-cycle watts so it is not reduced twice. Per-device schedule hours are intentionally excluded here; use Station Size or Complete Planner when different loads stop at different times.
Keep startup capability outside the duration arithmetic
Startup watts do not run for the whole runtime, so they are checked as an output constraint rather than added to average energy demand. Enter a known peak for motors and compressors and verify the allowed surge duration in the station specification. Missing AC startup data remains unknown instead of being replaced with a generic multiplier.
Account for the battery-side cost of each output path
AC and DC loads use their respective editable conversion efficiencies, and station overhead is added to the repeating battery demand. Overhead matters especially for small continuous loads such as network equipment. Avoid adding it separately when the entered load came from an end-to-end battery measurement that already captured the station’s own consumption.
Compare the estimate with a timed run
Treat the result as a repeatable energy-model estimate, not a guaranteed shutdown time. Charge the station to the entered starting percentage, operate the same load modes and stop at the chosen reserve. Temperature, battery protection, ageing and load-dependent efficiency can explain a measured difference and should be recorded before changing the calculator assumptions.
Common battery-runtime examples
Compare steady network, workstation and cycling DC load patterns.
Available energy divided by repeating battery demand
Each scenario first reduces nominal battery capacity by retention, starting charge and reserve. The engine then converts the repeating AC or DC load into battery-side demand before calculating depletion time.
FULL WORKED CALCULATION
Network backup
A 10 W router, 12 W modem and 15 W network switch run continuously from a 500 Wh battery.
- 1Available battery energy
- 2Average battery-side demand
- 3Estimated repeating-load runtime
A small continuous network load can run for many hours, so station overhead and the chosen reserve become material. The runtime answer describes a repeating load and does not reuse per-device hours from a sizing schedule.
Measure the combined router, modem and switch input over normal operation, then confirm the station’s idle demand and AC or DC conversion path.
CALCULATED EXAMPLE 1
Laptop and monitor
A 65 W laptop and 30 W monitor run continuously from a 1,000 Wh battery with a 20% reserve.
- Available battery energy
- 800 Wh
- Average battery demand
- 111.76 W
- Estimated runtime
- 7.16 h
The result is depletion time for a continuous 95 W pattern, not a scheduled workday budget.
CALCULATED EXAMPLE 2
Cycling portable cooler
A 60 W DC cooler runs at 35% duty and draws 3 W off-cycle from a 500 Wh battery.
- Available battery energy
- 450 Wh
- Average battery demand
- 25.5 W
- Estimated runtime
- 17.65 h
The duty and off-cycle inputs form an illustrative repeating pattern; measured averages are preferable when available.
CALCULATED EXAMPLE 3
CPAP battery runtime
A 40 W CPAP load repeats from a 500 Wh battery, starting full and stopping at a 20% reserve.
- Available battery energy
- 400 Wh
- Average battery demand
- 47.45 W
- Estimated runtime
- 8.43 h
Heated humidification and tubing can materially change the measured load.
More common calculations
Calculated by the same engine as the tool.
| Scenario | Entered plan | Calculated answer |
|---|---|---|
| Cycling refrigerator runtime | A 120 W refrigerator repeats at 35% duty with 5 W off-cycle power from a 1,000 Wh battery. | Available battery energy: 850 Wh · Average battery demand: 56.24 W · Estimated runtime: 15.12 h |
| Satellite terminal and laptop runtime | A 75 W satellite internet terminal and 65 W laptop repeat together from a 1,000 Wh station. | Available battery energy: 900 Wh · Average battery demand: 162.09 W · Estimated runtime: 5.55 h |
Calculated reference table
Each row uses a 100–10% battery window, 100% retained capacity, 85% AC efficiency and zero additional station overhead.
| Scenario | Inputs | Engine result |
|---|---|---|
| 500 Wh battery at 50 W | 500 Wh nominal battery; 50 W AC load | Available: 450 WhRuntime: 7.65 h |
| 500 Wh battery at 100 W | 500 Wh nominal battery; 100 W AC load | Available: 450 WhRuntime: 3.83 h |
| 1,000 Wh battery at 100 W | 1,000 Wh nominal battery; 100 W AC load | Available: 900 WhRuntime: 7.65 h |
| 1,000 Wh battery at 300 W | 1,000 Wh nominal battery; 300 W AC load | Available: 900 WhRuntime: 2.55 h |
| 2,000 Wh battery at 500 W | 2,000 Wh nominal battery; 500 W AC load | Available: 1,800 WhRuntime: 3.06 h |
These runtimes describe the entered repeating patterns. Temperature, battery protection, changing loads and real conversion curves can change measured operation.
Battery-runtime questions
Understand repeated loads, amp-hours and the causes of real-world runtime differences.
How long will a 1,000 Wh power station run a 100 W load?
The ideal ten-hour division is reduced by the usable charge window, capacity retention, conversion efficiency and station overhead. Enter those values with the 100 W load to calculate a result that matches the intended operating conditions.
How long can a power station run a refrigerator?
Runtime depends on the refrigerator’s average cycling demand, conversion losses and available battery energy. Use measured average watts at 100% duty, or enter running watts with a representative duty and off-cycle value.
Can a portable power station run a CPAP overnight?
Enter the CPAP’s representative power with the intended humidifier and heated-hose settings. The estimate can compare energy and output, but medical suitability and continuity requirements need confirmation from the device and power-station manufacturers.
Why does runtime view not ask for usage hours?
It estimates how long a repeating load can continue. A schedule where individual devices stop at different times is an energy-budget problem; use the sizing or complete-planner view for that calculation.
Can I estimate battery runtime from amp-hours?
Yes, when you know the nominal voltage associated with that amp-hour capacity. The calculator multiplies amp-hours by nominal volts to obtain watt-hours. Do not use an AC outlet voltage or charger output voltage unless it is the stated basis of the battery rating.
How do two appliances affect battery runtime?
Their battery-side demands are combined when both are active. Separate rows preserve different AC or DC efficiencies, cycling behavior and output checks.
How does reserve percentage affect runtime?
A higher reserve leaves more energy unused and shortens the calculated runtime. Reserve protects the planning window you choose; it should not be confused with a second efficiency loss.
Why is measured runtime different from the estimate?
Check actual average device power, conversion path, idle overhead, starting charge, reserve, temperature and battery condition. A deterministic estimate can only be as representative as those inputs.
How we validate this calculator
Power Planning Model v1 · 48 saved checks · reviewed 14 September 2026.
MODEL CHECK
A result you can reproduce
We run 48 saved examples, edge cases and combined checks before release. Each modeled relationship is mapped to an official primary source and at least one saved scenario. When we compare a published example, we first use the same inputs and assumptions.
- Status
- Desk-validated
- Saved cases
- 48
- Property checks
- 10,000
- Reference oracle
- Independent exact arithmetic
Published 700 Wh example
The inputs are normalized to the manufacturer example before comparing the displayed result.
- Inputs used
- 700 Wh battery; 70 W stable AC load; 85% path efficiency.
- Expected result
- 8.5 h runtime.
Manufacturer-manual cross-check
A second manufacturer vector checks that reserve and conversion efficiency remain separate factors.
- Inputs used
- 806 Wh battery; 90% available battery window; 90% conversion efficiency; 40 W load.
- Expected result
- 16.3215 h before display rounding.
Desk-validated means the documented arithmetic, exact boundaries and model invariants reproduce the stated results. It does not certify a product or predict weather, battery condition or field performance.
Sources and model limits
References used by this page, what is calculated and what still needs a specification or measurement.
Reviewed 14 September 2026. These references support the terminology and methods. Equipment presets and default efficiency values are examples, not facts about every product.
Technical references
- NREL Energy Basics — power and energy dimensions
Pages 3, 4 and 11 state E = P × t, P = E ÷ t and electrical P = V × I. This validates dimensions, not equipment performance.
- US Department of Energy — Energy Efficiency in the Home
Background on appliance electricity use. Historical educational material, not a current equipment catalogue.
- Victron — Inverter technical specifications
Shows why efficiency, idle demand, temperature and surge duration are separate specifications. Its product values are not universal defaults.
- Jackery — Watt-hour and battery ratings
Reference for energy units and the nominal-voltage requirement when starting from amp-hours. No product recommendation.
Included in this result
- Nominal capacity, starting charge, reserve and retention
- Repeating running, standby and station-overhead demand
- Entered continuous and startup output checks
Not modelled
This runtime model treats the entered load pattern as repeating and does not predict battery temperature effects, chemistry-specific discharge curves, inverter low-voltage shutdown, changing equipment demand or component ageing. The result is an energy estimate to compare with a representative timed test.